 PDF(3854 KB)

Research on Forest Canopy Height Inversion from Long Time Series and Multi Source Remote Sensing Data
Jinliang YAN, Guangrui ZHOU, Dexu ZHOU, Xiaojun ZHANG
Forest Engineering ›› 2024, Vol. 40 ›› Issue (6) : 1-10.
PDF(3854 KB)
 PDF(3854 KB)
Research on Forest Canopy Height Inversion from Long Time Series and Multi Source Remote Sensing Data
 ({{custom_author.role_en}}), {{javascript:window.custom_author_en_index++;}}
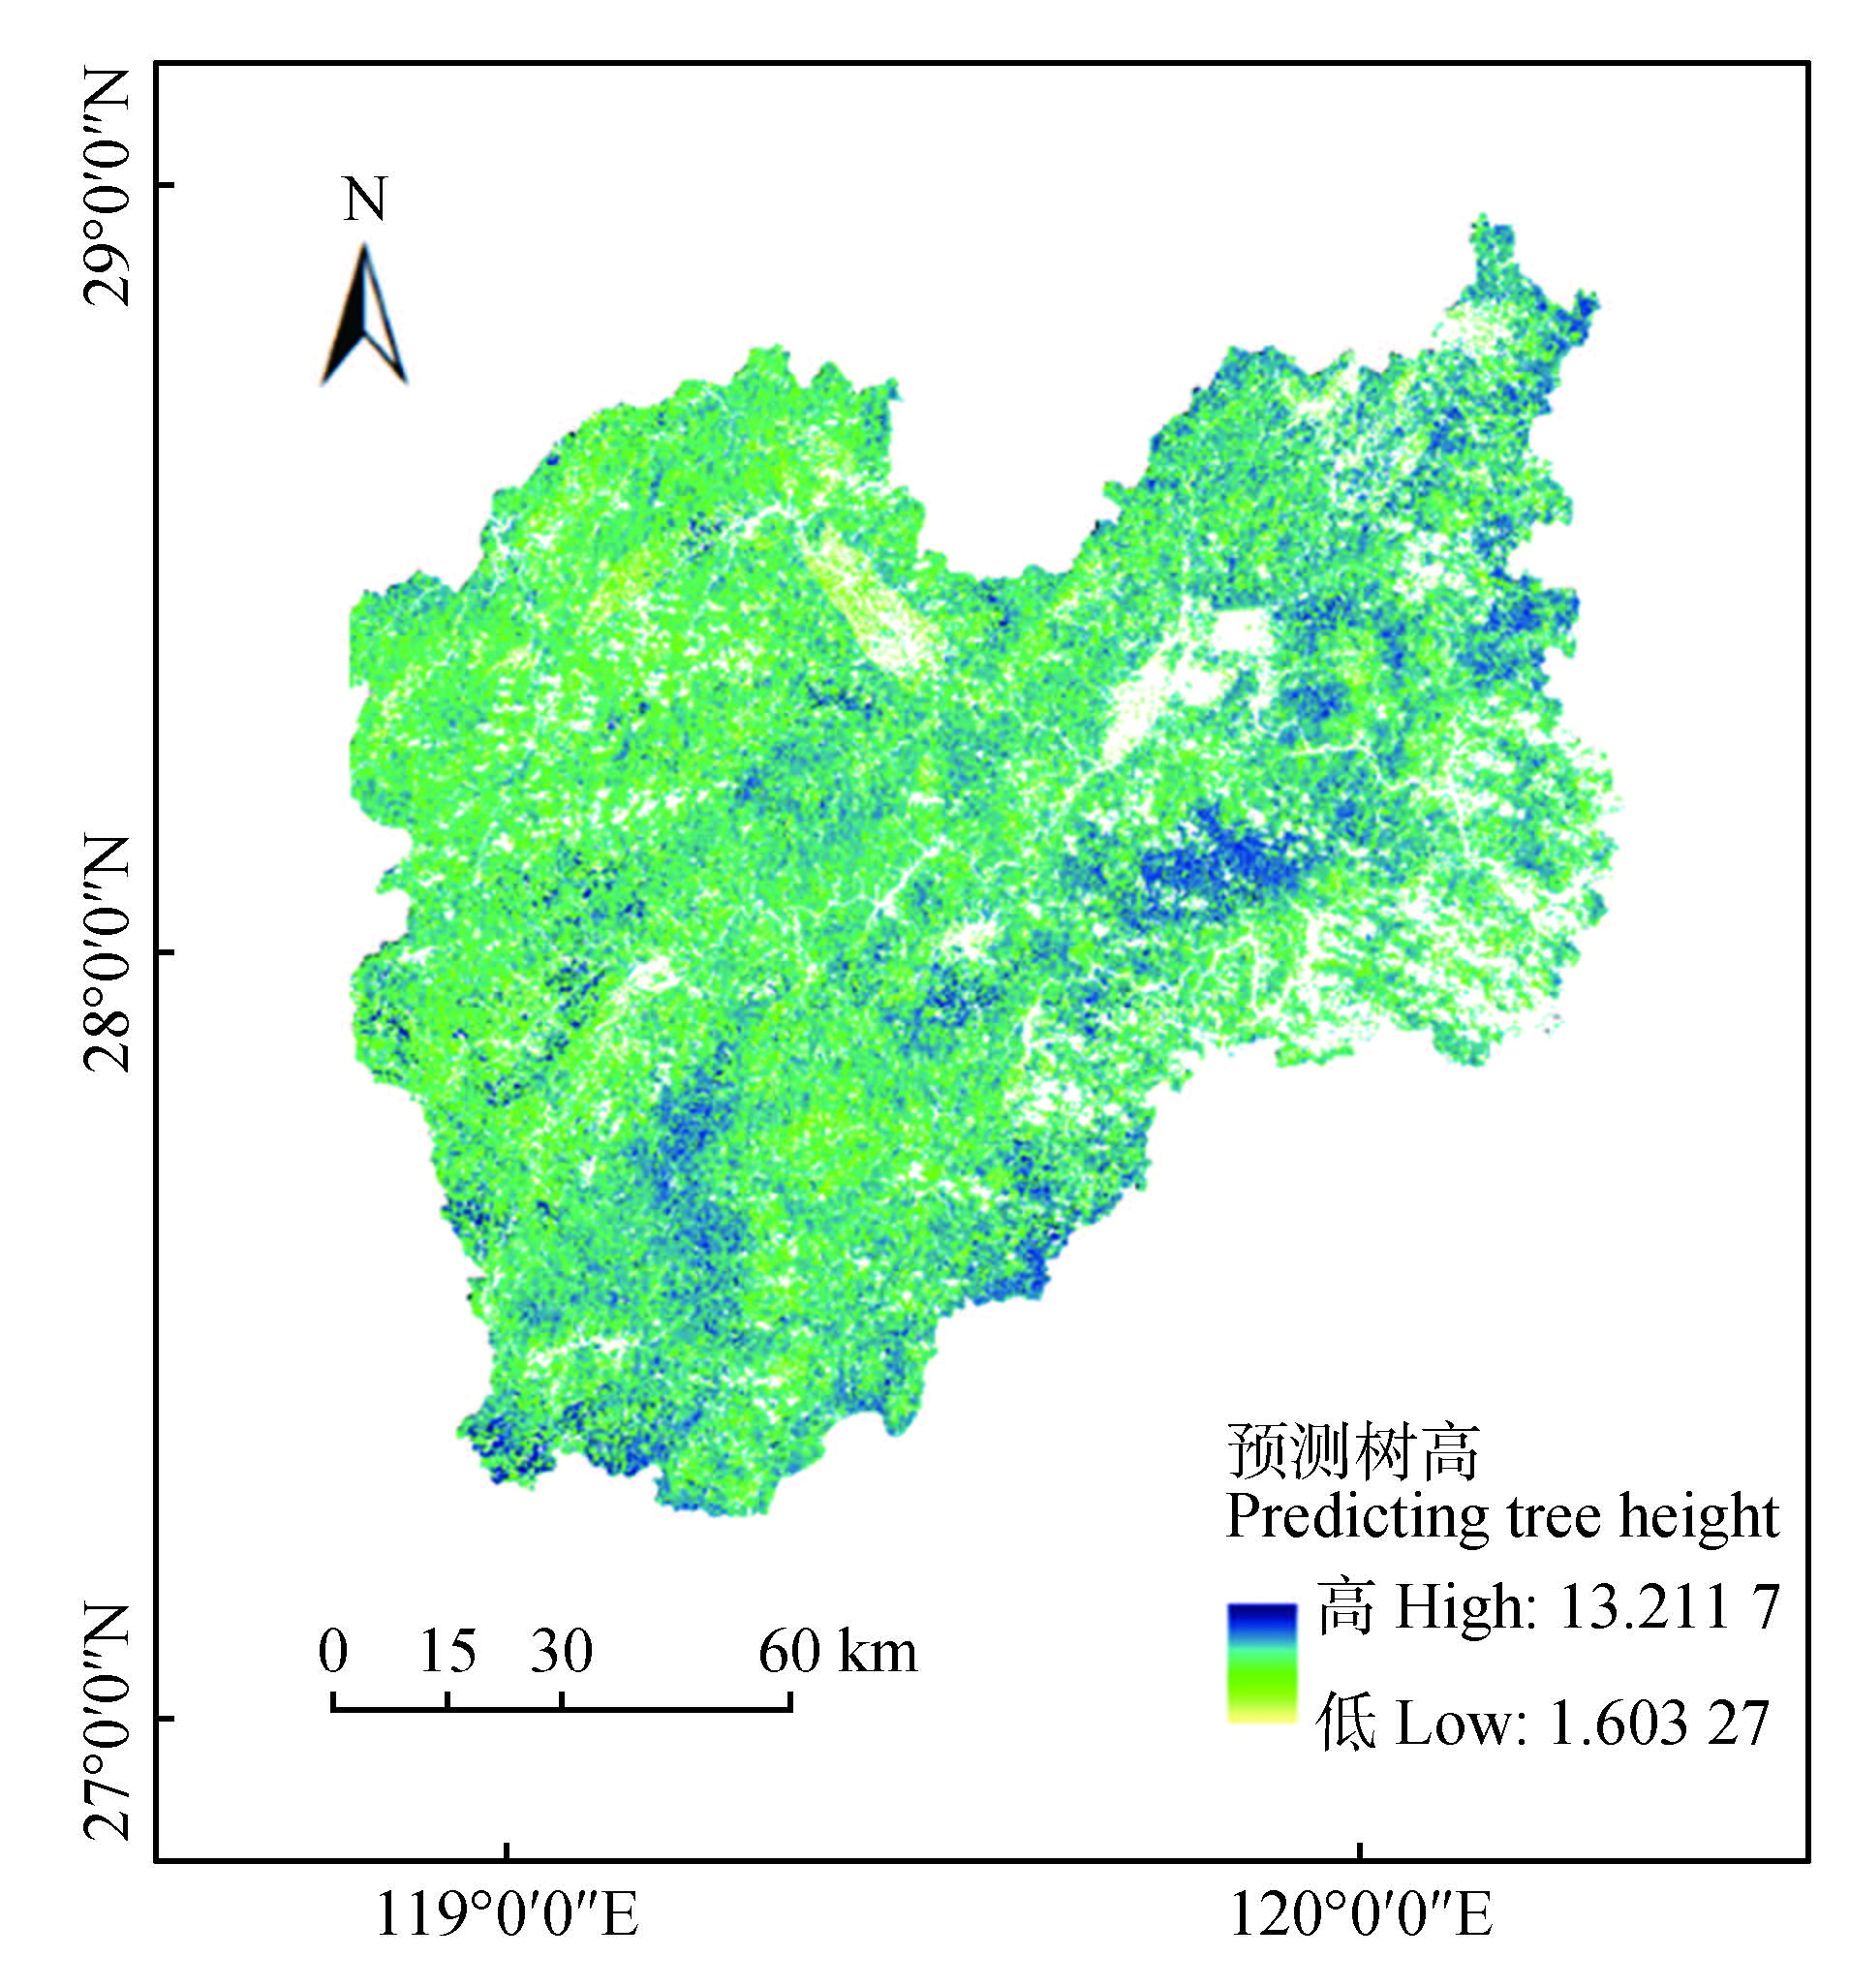
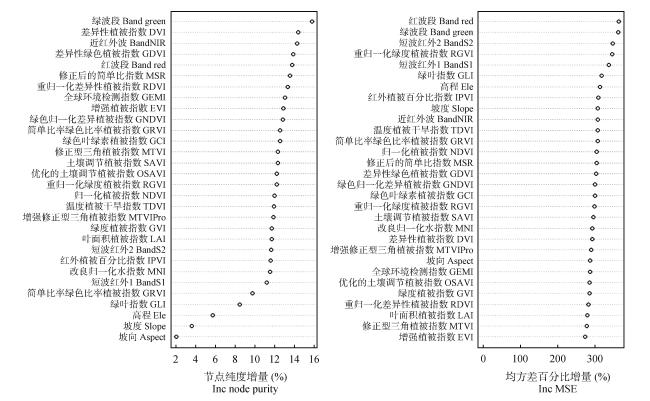
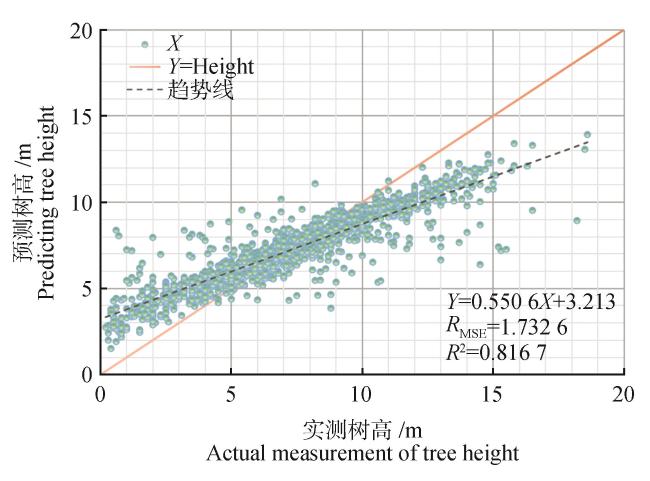
In order to accurately obtain forest canopy height information, accurately estimate forest aboveground biomass, and evaluate forest carbon sink capacity, this study constructed 30 long time series feature variables based on ground measurements, multi-source remote sensing data, and digital elevation models, combined with machine learning algorithms (ML), to invert the forest canopy height in Lishui City, Zhejiang Province. The study revealed that terrain factors had no significant impact on the inversion of forest canopy height, while vegetation factors related to the red and green bands were strongly correlated with forest canopy height. Adding long time series feature factors can help improve the accuracy of ML algorithm in inverting forest canopy height. The performance improvement of CNN was particularly significant, achieving an optimal coefficient of determination (R 2) increase of 0.39 and a root mean square error (RMSE in the formula, it is denoted as R MES) decrease of 4.15. Random forest had the highest inversion accuracy among the four ML algorithms (R 2=0.79, R MSE=1.65), greater than support vector machine (R 2=0.65, R MSE=1.97), extreme gradient ascent method (R 2=0.76, R MSE=1.81) and convolutional neural networks (R 2=0.71, R MSE=1.83).
Long time series feature / multi source remote sensing data / random forest / convolutional neural networks / forest canopy height inversion {{custom_keyword}} /
Tab.1 Data sources表1 数据来源 |
| 数据源 Data source | 获取时间 Acquisition time | 云量 Cloud cover | 数据量 /片 Data volume | 数据来源 Data source |
|---|---|---|---|---|
| Landsat4/5 | 1994、2004 | <5% | 2 369 | |
| Landsat7 | 2014 | 3 681 | ||
| Landsat8/9 | 2022 | 4 773 | ||
| DEM | 2022 | — | — | |
| 矢量边界 Vector boundary | — | — | — | |
Tab.2 Vegetation indices,terrain characteristics, and formulas表2 各植被指数与地形特征及公式 |
| 特征参数 Characteristic parameter | 公式 Formula | 特征参数 Characteristic parameter | 公式 Formula |
|---|---|---|---|
| 差异性植被指数 (DVI,式中记为D VI) | | 归一化植被指数 (NDVI,式中记为N DVI) | |
| 增强植被指数 (EVI,式中记为E VI) | | 优化的土壤调节植被指数 (OSAVI,式中记为O SAVI) | |
| 绿色耐大气植被指数 (GARI,式中记为G ARI) | | 重归一化差异性植被指数 (RDVI,式中记为R DVI) | |
| 绿色叶绿素植被指数 (GCI,式中记为G CI) | | 重归一化绿度植被指数 (RGVI,式中记为R GVI) | |
| 差异性绿色植被指数 (GDVI,式中记为G DVI) | | 土壤调节植被指数 (SAVI,式中记为S AVI) | |
| 全球环境检测指数 (GEMI,式中记为G EMI) | | 温度植被干旱指数 (TDVI,式中记为T DVI) | |
| 绿叶指数 (GLI,式中记为G LI) | | 绿度植被指数 (GVI,式中记为G VI) | G VI=-0.284 8×B AND1-0.243 5×B AND2-0.543 6×B AND3+0.724 3×B AND4+0.084 |
| 绿色归一化差异植被指数 (GNDVI,式中记为G NDVI) | | 短波红外1 BandS1 | — |
| 简单比率绿色比率植被指数 (GRVI,式中记为G RVI) | | 短波红外2 BandS2 | — |
| 红外植被百分比指数 (IPVI,式中记为I PVI) | | 红波段 BandRed | — |
| 叶面积植被指数 (LAI,式中记为L AI) | | 绿波段 BandGreen | — |
| 改良归一化水指数 (MNI,式中记为M NI) | | 近红外波段 BandNIR | — |
| 修正后的简单比指数 (MSR,式中记为M SR) | | 高程 Elevation | — |
| 修正型三角植被指数 (MTVI,式中记为M TVI) | | 坡度 Slope | — |
| 增强修正型三角植被指数 (MTVIPro,式中记为M TVIPro) | | 坡向 Aspect | — |
Tab.3 Regression accuracy of different data source compositions and corresponding models表3 不同数据源组成及相应模型的回归精度 |
| 数据源组成 Composition of data sources | 模型 Model | R 2 | RMSE |
|---|---|---|---|
| 单一年份 Single year | RF | 0.72 | 1.73 |
| SVM | 0.64 | 2.03 | |
| XGBoost | 0.71 | 1.95 | |
| ResNet18 | 0.32 | 5.98 | |
| 2 a(1994、2014) Two years(1994,2014) | RF | 0.75 | 1.65 |
| SVM | 0.65 | 1.93 | |
| XGBoost | 0.74 | 1.89 | |
| ResNet18 | 0.62 | 2.19 | |
| 3 a(1994与2004、2014) Three years(1994 and 2004,2014) | RF | 0.79 | 1.65 |
| SVM | 0.65 | 1.97 | |
| XGBoost | 0.76 | 1.81 | |
| ResNet18 | 0.71 | 1.83 |
| 1 |
{{custom_citation.content}}
{{custom_citation.annotation}}
|
| 2 |
{{custom_citation.content}}
{{custom_citation.annotation}}
|
| 3 |
{{custom_citation.content}}
{{custom_citation.annotation}}
|
| 4 |
{{custom_citation.content}}
{{custom_citation.annotation}}
|
| 5 |
{{custom_citation.content}}
{{custom_citation.annotation}}
|
| 6 |
{{custom_citation.content}}
{{custom_citation.annotation}}
|
| 7 |
{{custom_citation.content}}
{{custom_citation.annotation}}
|
| 8 |
谢开翼,陈瑞波,王志莉,等.广西-东盟多源遥感数据的森林高度反演及应用[J].测绘通报,2024(1):32-37,64.
{{custom_citation.content}}
{{custom_citation.annotation}}
|
| 9 |
李霞,刘兴明,孙斌,等.基于机器学习算法的甘肃省草原地上生物量[J].草业科学,2024,41(2):297-307.
{{custom_citation.content}}
{{custom_citation.annotation}}
|
| 10 |
刘书田,王雪梅,赵枫.基于Sentinel-2的绿洲-荒漠过渡带植被地上生物量估算[J].干旱区资源与环境,2024,38(4):162-170.
{{custom_citation.content}}
{{custom_citation.annotation}}
|
| 11 |
段云芳,罗洪斌,岳彩荣,等.应用UAVSAR数据及改进极化水云模型对热带森林地上生物量反演[J].东北林业大学学报,2024,52(1):54–60.
{{custom_citation.content}}
{{custom_citation.annotation}}
|
| 12 |
刘思康,史泽林,宋宏阳,等.坡度对应用机载激光雷达估测人工针叶林单木参数的影响[J].东北林业大学学报,2021,49(4):45-51.
{{custom_citation.content}}
{{custom_citation.annotation}}
|
| 13 |
{{custom_citation.content}}
{{custom_citation.annotation}}
|
| 14 |
{{custom_citation.content}}
{{custom_citation.annotation}}
|
| 15 |
{{custom_citation.content}}
{{custom_citation.annotation}}
|
| 16 |
蔡林菲,吴达胜,方陆明,等.基于XGBoost的高分二号影像树种识别[J].林业资源管理,2019(5):44-51.
{{custom_citation.content}}
{{custom_citation.annotation}}
|
| 17 |
{{custom_citation.content}}
{{custom_citation.annotation}}
|
| 18 |
{{custom_citation.content}}
{{custom_citation.annotation}}
|
| 19 |
{{custom_citation.content}}
{{custom_citation.annotation}}
|
| 20 |
{{custom_citation.content}}
{{custom_citation.annotation}}
|
| 21 |
{{custom_citation.content}}
{{custom_citation.annotation}}
|
| 22 |
{{custom_citation.content}}
{{custom_citation.annotation}}
|
| 23 |
{{custom_citation.content}}
{{custom_citation.annotation}}
|
| 24 |
何金有,贾炜玮,张小勇,等.应用PROSAIL模型对森林冠层叶面积指数遥感估测[J].东北林业大学学报,2023,51(11):86-94.
{{custom_citation.content}}
{{custom_citation.annotation}}
|
| 25 |
{{custom_citation.content}}
{{custom_citation.annotation}}
|
| 26 |
{{custom_citation.content}}
{{custom_citation.annotation}}
|
| {{custom_ref.label}} |
{{custom_citation.content}}
{{custom_citation.annotation}}
|


 PDF(3854 KB)
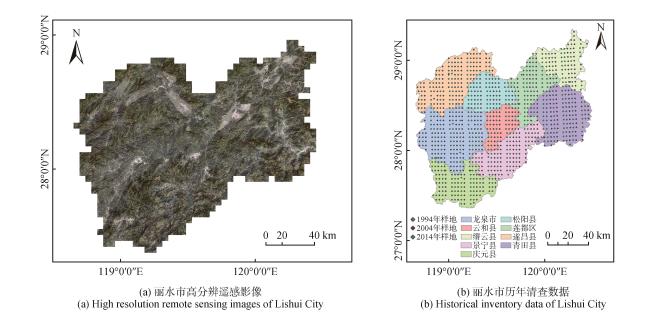
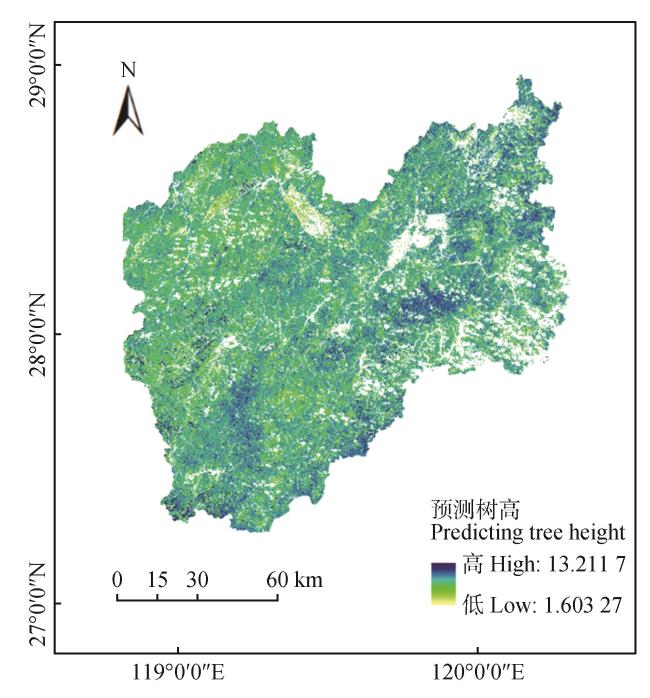
 Fig.1 Image and historical inventory data of Lishui City
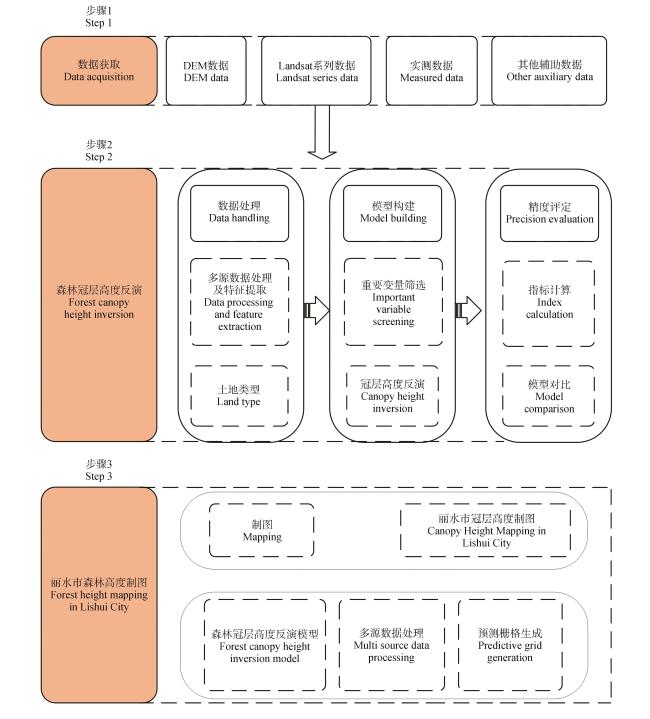
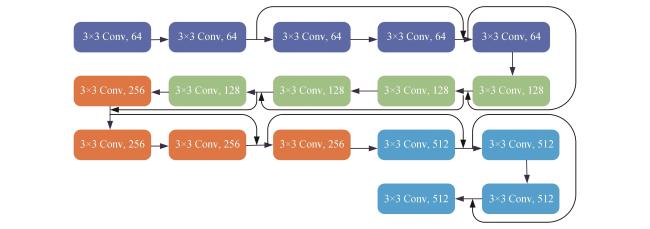
 Tab.1 Data sourcesFig.2 Research methodsTab.2 Vegetation indices,terrain characteristics, and formulasFig.3 ResNet18 regression modelFig.4 Feature factor screeningTab.3 Regression accuracy of different data source compositions and corresponding modelsFig.5 Forest canopy distribution in Lishui City in 2022Fig.6 RF accuracy(350 sample points,P value is 0.002)
/
| 〈 |
|
〉 |


